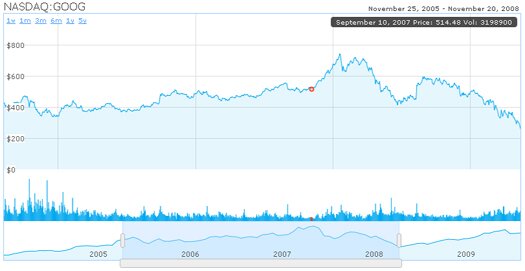
HTML5 Charting & Data Visualization Tool: HumbleFinance
HumbleFinance is an HTML5 data visualization tool written as a demonstration of interactive graphing in HTML5. This HTML5 charting tool is written entirely in JavaScript, using the Prototype and Flotr libraries. It can be used to display any two 2-D data sets of real numerical data which share an axis.

You can mouse over the chart for additional data, as well as zoom and pan the charts using the grey buttons.
2 Responses
[...] This post was mentioned on Twitter by esarfraz, HTML5 Guy. HTML5 Guy said: HTML5 Charting & Data Visualization Tool: HumbleFinance http://bit.ly/dba3fl: HTML5 Charting & Data Visualization … http://bit.ly/aPcpRg [...]
[...] Saif пишет: The HTML5 charting tool is written entirely in JavaScript, using the Prototype and Flotr libraries. It can be used to display any two 2-D data sets of real numerical data which share an axis. You can mouse over the chart for additional … [...]